Getting raw access logs out of shared hosting
With no server access, logs come through a control panel. Here is the checkbox that keeps them, and why some lines belong to other people’s sites.
The NessFlow team (Product engineering, NessFlow) · · 2 min read
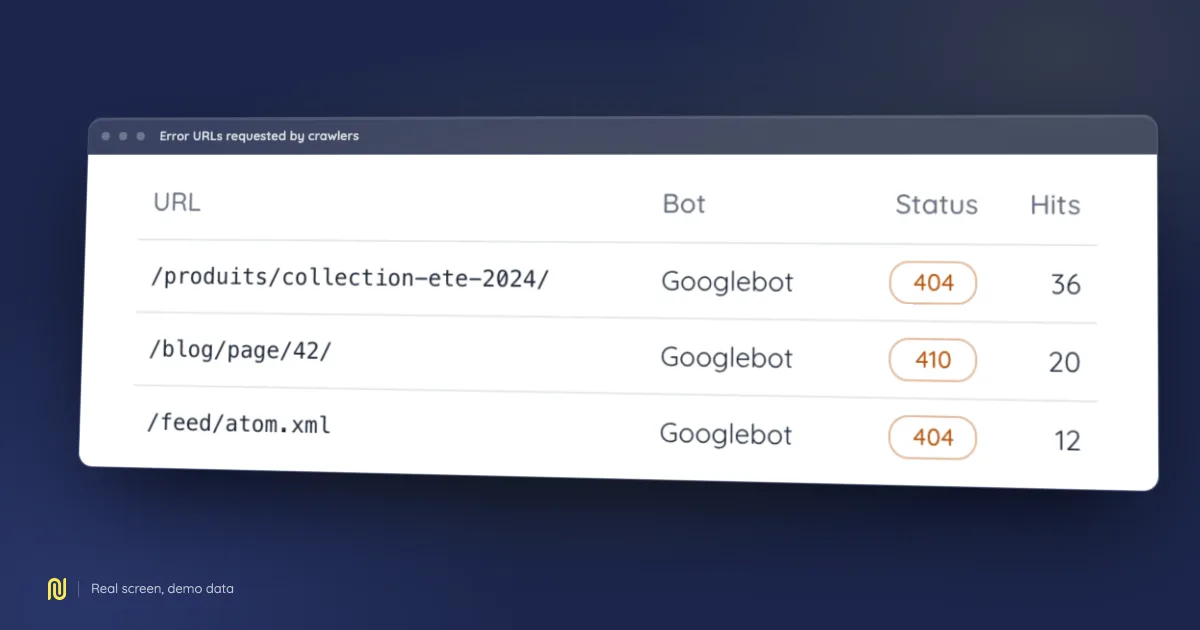
A real product screen, rendered on a fictional demo dataset: the figures shown belong to no client.
On shared hosting you have no shell on the server, and that is fine: the control panel exports exactly what is needed. The only obstacle is that it does not do so by default.
The checkbox that keeps your files
In cPanel, open Metrics, then Raw Access. At the top of the page sits a checkbox reading "Archive logs in your home directory at the end of each stats run". Tick it and save.
While it stays unticked, last month's logs are deleted when statistics are recalculated. Most people find that checkbox on the day they go looking for a period that no longer exists. There is no way to recover it afterwards: tick it today, even if the analysis is planned for later.
Just below, the page offers a download link per domain and subdomain. The file arrives compressed, named after the domain and the date.
The format you get
These panels almost always serve combined, the same format as a directly administered nginx or Apache server. So there is nothing to configure: declare shared hosting as your origin and the format follows.
Do check that a line ends with a user agent in quotes. A few hosts still offer a short format that stops at the byte count, and that one identifies no crawler at all.
The lines that are not yours
A shared server hosts dozens of sites. Depending on how your host splits its files, your export may contain lines belonging to other domains, or to technical subdomains you are not auditing.
That is normal, and the analysis drops them by itself by comparing each line's host with your project's. The import report shows them separately, labelled "other domains on this server", precisely so that a large number does not read as a failure.
A period worth having
The statistics cycle is monthly with most hosts, so the archive gains one file per month. Two or three months give a far more reliable picture than a single week, because engines do not revisit every page at the same pace.
Next
Upload the archive as is, without expanding it. For what can be concluded from it, see our guide to server log analysis, and the log analysis module page.