Getting your Cloudflare logs out with Logpush
Cloudflare answers for your server on a large share of traffic. Here is how to get its own logs, and what origin logs quietly leave out.
The NessFlow team (Product engineering, NessFlow) · · 2 min read
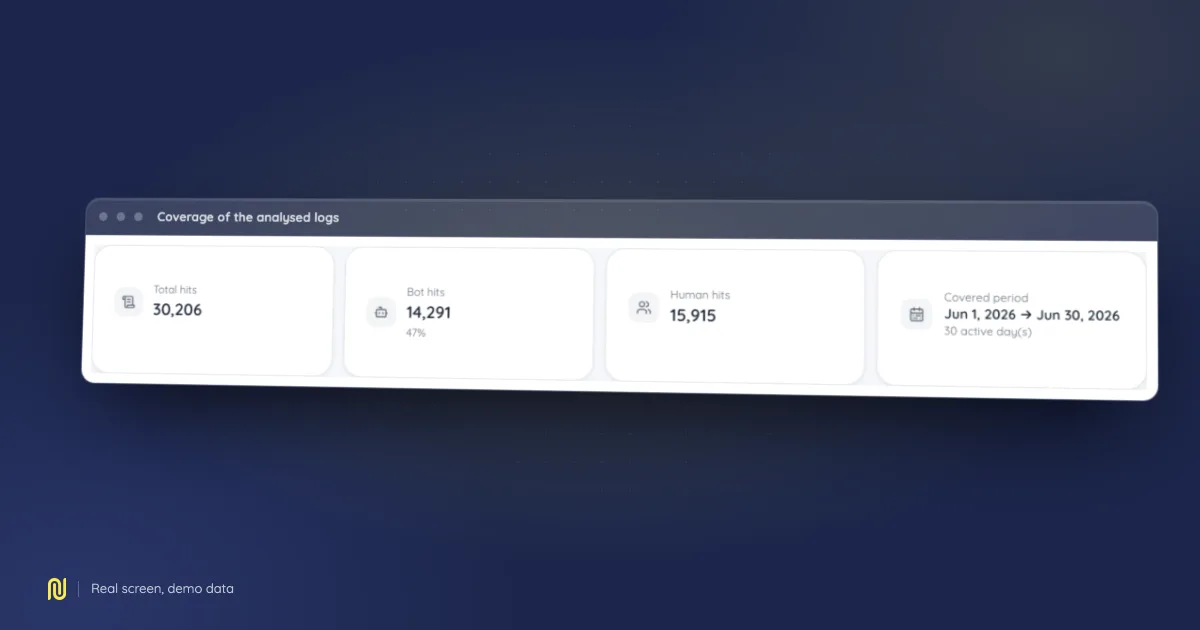
A real product screen, rendered on a fictional demo dataset: the figures shown belong to no client.
Once a site sits behind Cloudflare, a share of requests never reaches the origin server: they are served from cache. Origin logs therefore describe what got through, not what engines asked for. On a well-cached site the gap is large, and it falls precisely on the pages you most want to watch.
What Logpush gives you
Logpush ships Cloudflare's own logs to storage you choose, at a regular interval. It is the only source that sees every request, cache hits included.
It requires a paid plan. On a free plan the only route left is origin logs, with the caveat above: they undercount crawler traffic on exactly the pages that matter.
Creating the job
In the dashboard, open the zone, then Analytics & Logs, then Logpush. Create a job on the HTTP requests dataset and pick a destination: S3-compatible object storage, a Google Cloud Storage bucket, or a plain HTTP endpoint.
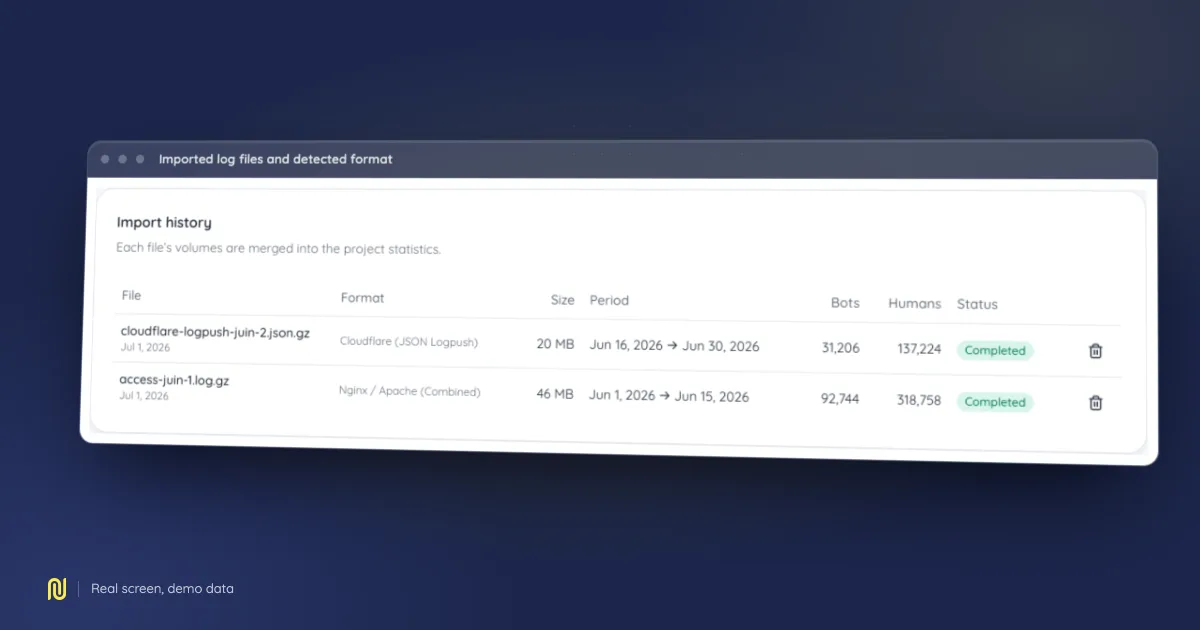
Output is JSON, one request per line. That is what the import wizard expects when you declare Cloudflare as your origin.
The fields that matter
The picker offers dozens of fields and the temptation is to tick them all. Five are enough for traffic analysis, and ticking fewer makes the transfer far lighter.
EdgeStartTimestamp, when the request happened;ClientRequestHost, essential if the job covers several domains;ClientRequestURI, the path requested;EdgeResponseStatus, the status actually served;ClientRequestUserAgent, without which no crawler can be identified.
Two fields deserve a deliberate decision. ClientIP serves no purpose in traffic analysis, and an address is personal data: the simplest choice is not to export it at all. CacheCacheStatus, on the other hand, earns its place: it tells you what share of your pages never reaches the origin, which is the whole reason for using Logpush.
Give it a period
A Logpush job starts when you create it; it does not reach backwards. Allow a few days between setup and a first analysis worth reading. A full crawl cycle often takes more than a week on a mid-sized site.
Next
Files arrive compressed and upload as is. If your job covers several domains, the analysis drops lines belonging to other hosts by itself, using ClientRequestHost.
For what comes out of the data, see our guide to server log analysis. The crawlers we recognise are listed in the bot directory.