Rank tracking: building a reading that compares over time
A ranking is not a property of your page: it is the result of a measurement, and a measurement only compares against another taken under the same conditions. The five settings to freeze, the three states of a reading, and the reference to judge a drop against.
The NessFlow team (Product engineering, NessFlow) · · 6 min read
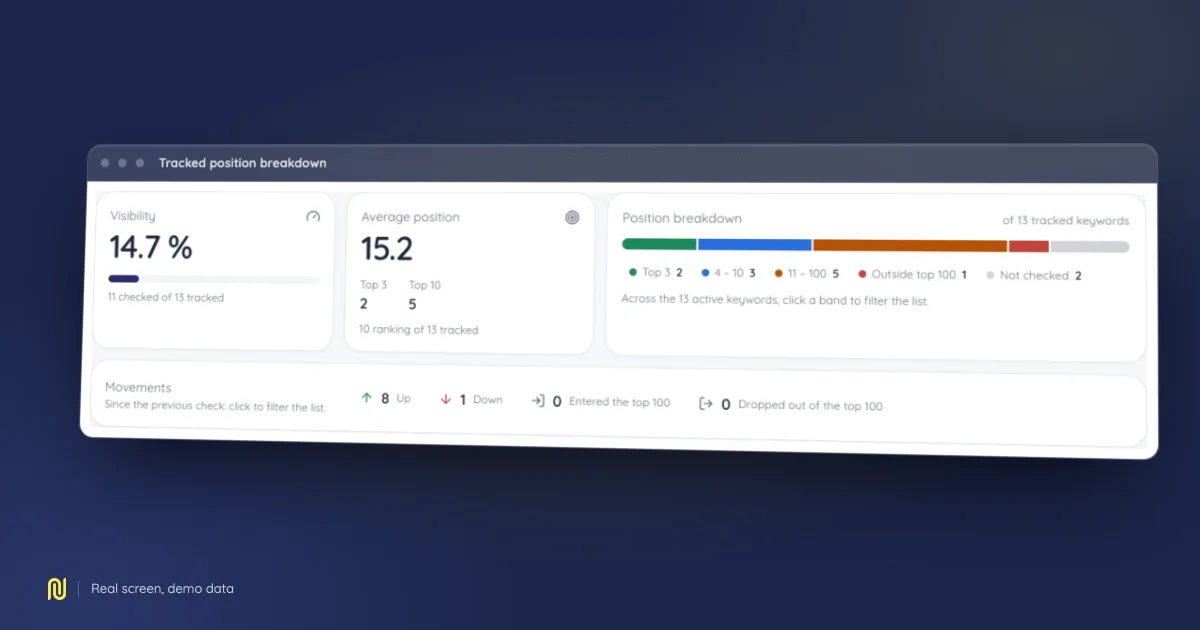
A real product screen, rendered on a fictional demo dataset: the figures shown belong to no client.
“We lost rankings.” The sentence comes up in every monthly review, and it is nearly always impossible to demonstrate, because the only question that matters was never asked before anything got measured: compared against what?
A ranking is not a property of your page the way its title or its weight are. It is the result of a measurement, taken at a moment, for a query, in a language, from a country, on a device type, by an engine that tests continuously. Change any one of those and you are measuring something else. This guide covers how to fix the conditions, then how to read what comes out.
The five settings to freeze
There are few of them and they are decided once, at the start. The cost of leaving them loose stays invisible for months, then becomes fatal: two incomparable readings stacked on one chart.
- The exact query. “hiking boots” and “hiking boot” are two queries with two results pages. A useful tracker works on exact strings, written once and never touched again, otherwise the series silently restarts.
- The interface language. It governs how the engine interprets the query, and it is independent from the country.
- The country, or the city when the query is local. For a locally intended query, a national measurement describes almost nothing: the results served differ from one metro area to the next.
- The device type. Results pages served on mobile and on desktop differ, in composition as well as in order. Pick the one that matches your real traffic and hold it. Melting the two into an average produces a number that describes no existing screen.
- The engine. Obvious, and yet: a table mixing two engines reads as a single series.
The principle that makes everything else possible: a frozen measurement travels with the configuration that produced it. If your reading does not store its five settings next to the number, nobody will be able to say, six months from now, whether the decline came from the market or from a parameter someone changed on a Tuesday.
Three states, never two
This is the highest-return distinction in the whole subject, and the one most dashboards ignore.
- Measured: the position was read, and it is what it is.
- Measured, outside the reading: the engine answered, and your domain does not appear within the depth explored. That is a fact, dated and actionable.
- Not measured: the reading never happened. Network outage, quota reached, query refused, collection still running. That is nothing; above all it is not a zero.
Confusing the last two is the most expensive defect here. A dashboard that writes zero for a missed reading sinks the curve on the day of an outage, triggers a meeting about a collapse that did not happen, and destroys trust in the instrument, which is far worse than the false alarm itself.
On screen, the third state renders empty, with a dash. And a chart that spaces its points by index draws a collection gap exactly like a normal interval: if your tool does not flag the missing days, you are reading a continuity that does not exist.
What to compare against
Three candidates present themselves. Two are bad.
The previous reading is the worst choice. Results pages are non-deterministic: two consecutive measurements can differ with nothing having happened. Comparing against the last point means measuring noise.
The mean is better, but it remembers accidents. A day when your page was down, or a particularly brutal engine test, drags the mean down and raises by the same amount the threshold above which you would detect a real drop.
The median is the right default. It describes the usual regime of the series and ignores extreme values, which is precisely the property you want on a noisy quantity.
Add a noise floor, and scale it to your sample size. On a handful of tracked queries, every movement is a tenth of the whole; across several hundred, the same absolute movement is a detail. A threshold written in fixed points is therefore unusable: it fires constantly on small trackers and never on large ones.
What a position does not say
A position describes a rank on a page. It describes neither the click nor the surface occupied on screen.
A modern results page stacks blocks above the links: rich snippets, local packs, people-also-ask, featured answers, carousels. A first place under several blocks is worth less than a second place under none, and a tracker that records only the rank will never see the difference. Record the blocks present alongside the position: it is the same query, so the same measurement, and it explains half of every “we rank first and traffic is falling”.
For the other half you need a second source. Cross your rankings with the impressions and clicks reported by Search Console: the position says where you are, Search Console says what it earns. A query where you gain ranks without gaining clicks is a finding neither source produces alone.
Cadence is a cost decision
Every reading is a call to a data provider, and it is billed. That makes cadence far more interesting to choose than it looks.
A daily reading is the right regime for almost everyone: frequent enough to place a drop within a few days, spaced enough to keep the invoice proportionate. An hourly reading multiplies the cost to measure mostly intraday variation, which you could not act on anyway. A weekly reading, at the other end, makes “what did we change that day” undecidable.
Two precautions are worth writing down, because they get paid for on the first oversight:
- the guard sits on the ATTEMPT, not on success. Otherwise a pass interrupted halfway leaves the door open, and a simple retry re-pays for calls already billed;
- the slot stays daily even when the cadence is slower. A guard of the form “wait seven days since the last reading” ends up skipping passes, because the interval drifts with the execution time. The slot opens every day, and the cadence lives in the guard.
Reading the chart
Two rendering details, neither of them cosmetic.
The axis is drawn inverted. A better position is a smaller number: on a conventional rising axis every improvement goes down, and everyone reads the chart backwards for the first three seconds. First place belongs at the top.
The scale follows the signal, not the scoring range. Forcing the axis from zero to one hundred squeezes a fall from sixth to third place into a few pixels. If the tracker lives in a sub-range, the axis adapts to it.
What is left to decide
None of the above is hard. What takes discipline is holding it over time: keeping the same queries, leaving the settings alone, preserving the missing days instead of filling them in, and refusing to comment on a variation that fits inside the noise.
A tool does not replace those decisions; it makes them sustainable, by taking the measurement every day under the same conditions and keeping those conditions with it. The rest, the reading, the judgement, the choice to fix or to wait, stays your work.